

ISSN: 0973-7510
E-ISSN: 2581-690X
Bioactive isolation was performed on the stem bark of Datuan (Ficus vasculosa Wall. Ex Miq), and extraction was carried out via the maceration method using acetone as a solvent. Furthermore, an attractant bioactivity test was conducted on acetone extract, A-G fraction, and composition of the isolates. The separation and purification via column chromatography produced a D8.3.5.7 fraction in the form of needle crystal of about 50 mg, at a melting point of 136°C–138.7°C. Thin-layer chromatography (TLC) analysis showed a single spot at an Rf value of 0.57 (n-hexane eluent: ethyl acetate 7:3), 0.36 (DCM eluent), and 0.24 (CHCl3 eluent). The isolated compounds were identified using infrared and UV–Vis spectrophotometry, as well as mass spectrometry. The characterization of the infrared spectrum of the isolated compound showed a strong OH goo band at 3461 cm-1 region and the absorption band at 2936.25 cm-1 exhibited a stretch of CH alkanes. These two bands are supported by the vibration at 1378.47 and 1462.55 cm-1 for CH absorption of methyl and methylene. The absorption band in the 1622 cm-1 region showed a stretch of conjugated C=C double bond, which is supported by absorption at 918.96 and 966.22 cm-1 as C–H alkene. The UV–Vis spectrophotometry showed absorption at λmax 263.97 nm A = 0.483, which was the result of electronic transition π → π*, and at λ 331.0 nm A = 0.274, which was an electronic result of n → π*. Meanwhile, identification via mass spectrometry that produces isolate has a molecular weight of 414.1 m/e with the formula C29H50O. Therefore, the bioactivity test results on compound D8.3.5.7 had an attractant activity of 71.67% against warehouse pests (Sitophilus oryzae L.) and an interest index of 0.63.
Attractant, bioactive, F. vasculosa Wall.ex Miq., S. oryzae
Ficus is a plant genus from the family of Moraceae and order Morales, commonly found in tropical and subtropical areas worldwide.1,2 Over 500 species of this plant can be found in Indonesia and are widespread around Sumatera (102 species), Kalimantan (106 species), Papua (99 species), Sulawesi (83 species), Java (75 species), Maluku (71 species), and Nusa Tenggara (36 species).3 In general, the plant is a large woody tree that grows at a height of 30–50 m with a diameter of 90–110.1 The plant is usually harvested for dry and fresh consumption, especially its fruit, wood, bark, root, and leaves. Some of the parts, such as phloem fibers, are a good substitute for hemp. Moreover, the fruits of some species are edible and used as medicine. Many Ficus species are hosts to insects or warehouse pests that secretes resinous substances. Furthermore, they have some important components that are obtained for consumption or used as traditional medicine, bioactive compound, antioxidant, and pharmacological agent for human health improvement1.4,5
The sample of Ficus used in this work was obtained from Lampung, known as the Datuan plant (North Lampung). In other regions, it is known as Burut, Huru Awis, Ki Kopeng, and Ki Kuya (Sunda); its generic name is Fig (English), Ara (Malaysia), and other synonymous names.6 Studies showed numerous species of the Datuan plant are harvested and consumed due to the presence of important chemical compounds, including vitamins, minerals, carbohydrates, sugars, organic acids, phenolic compounds, flavonoids, tannins, and some other secondary metabolite compositions.7 The compounds have been pharmacologically and phytochemically studied in other studies due to their chemical constituents used medicinally.8 The plant’s compositions of F. vasculosa Wall.ex Miq. (FvWM) are not only used in health but are also involved in some bioactivity tests.9,10
The FvWM contains some secondary metabolites of phenolic compounds, flavonoids, terpenoids, and steroids.11 The phenolic compounds can be classified as flavonoids and their derivatives, such as catechins, epicatechins, quercetins from F. sycomorus leaves, and isoflavones, including genisteinare and prunetin from F. polita, were isolated.12 Meanwhile, the bioactive compounds of the terpenoid group which are commonly isolated from the Ficus species are taraxeryl acetate, betulinic acid, and some other compounds, such as bergapten, fumaric acid, 1,4-dimethyl-7-isopropylazulene, lupeol, xanthotoxin, and more.12 Other important classes of bioactive compounds found in the genus are steroids, namely β-sitosterol isolated from F. polita and β-sitosterol-D-glucoside isolated from F. glomerata and F. cordata stem bark.13 The essential oil was also reported to be abundant in the F. ovata species i.e., (E)-menth-2-en-1-ol, β-caryophyllene, α-pinene, 2-hexen-1-ol benzoate, limonene, simiarenol, fatty acids, aldehydes, ketones, and long-chain aliphatic hydrocarbons.14,15 The biological activities of the isolated compounds of F. carica species have been studied and reported that many of the secondary metabolite compounds exhibit antioxidant, anticancer, hepatoprotective, hypoglycemic, hypolipidemic, antibacterial, antipyretic, antituberculosis, irritant potential, nematicidal, antispasmodic, antiplatelet, anthelmintic, antimutagenic, as well as anti-HSV activities and oxidative stress.10,16
The present study aims to obtain bioactive compounds in the stem bark of the Datuan plant (FvWM). The bioactivity test was conducted on S. oryzae L., which is a warehouse pest in agricultural product. Extraction via maceration method using acetone as a solvent was performed to obtain the isolation compounds. Also, purification was determined through vacuum liquid chromatography (VLC) with reserved-phase gel silica Merck 60 (10–40 μm) and gel silica Merck 60 GF254 (63–200 μm) in the column. The purity of the isolated compounds was tested using thin layer chromatography (TLC), with eluents of n-hexane/ethyl acetate 7:3, dichloromethane (DCM), and CHCl3. Moreover, the melting points were determined to be 136–138.7°C, and the molecular structures were identified using UV–Vis spectrophotometry, IR spectroscopy, and GC–MS analysis.
Sample Preparation
The stem bark of the Datuan was collected at Batunangkop Village, North Sungkai, Lampung, Sumatera, Indonesia.
Extraction and Isolation
The sample was cleaned with water and dried at room temperature. Then, a 3-kg dried stem bark was macerated using acetone as the solvent for 6 × 24 h. The resultant extract was evaporated for about 24 h in a vacuum rotary evaporator (60–70 rpm) at 25°C. In addition, the concentrated extract was obtained as a crude acetone extract, and the samples were collected, weighed, and stored in a desiccator for further use.
Determination of Phytochemical Activity
Contents of crude acetone extractable flavonoids
Crude acetone extract (5 mL) was placed in a colorimeter tube, and then 10% aqueous NaOH was added. Yellow-orange-red colors and white precipitation indicated the samples contained positive flavonoid.
Contents of crude acetone extractable steroids
Crude acetone extract (5 mL) (2 mL H2SO4) was obtained, and then 2 mL of anhydrate acetate acid was added. The solution was thoroughly mixed, and the resulting positive steroid content showed blue or green colors. Otherwise, when purple-black color is shown, the samples would be considered to contain terpenoid.
Contents of crude acetone extractable terpenoi
Crude acetone extract (5 mL) was mixed with 2 mL of chloroform and 3 mL of concentrated H2SO4. The brown-red colors indicated the samples contain terpenoid.
Biological Activity Assays
The bioactivity of crude acetone extract samples was determined using the procedure available in the literature.17 The crude acetone and plant extract was screened for bioactivity against pests. In this assay, the pest (S. oryzae L.) was supplemented with two conditions in which the first was edible from the crude extract as attractant while the second was not edible. These treatments were seeded with 10 pests on the plates. Each sample on the plates was monitored for 24 h after fasting of the 10 pests for 12 h. In addition, treatment evaluation was determined with data that can be calculated using attractive index (AI) and the percentage of attractive approach.
Equation (1) is used to determine the percentage of attractive:
% Attractive = (∑(a))/(∑(n)) × 100%
Equation (2) is used to obtain attractive index (AI):
AI = (∑(a) -∑(b))/(∑(n)- ∑(b))
where ∑(a) denotes the number of interested insects; ∑(n) is the number of released insects when the extract has been added at a particular level; and ∑(n) is the amount of Blanco insects as a control.
Fractionation and Purification
The samples of crude acetone extract were fractionated via VLC with graded eluents semi-polar using reserved-phase gel silica Merck 60 (10–40 μm) and gel silica Merck 60 GF254 (63–200 μm) in the column. After obtaining the fractions from VLC, the sample fractions were dissolved in eluent mixture of (n-hexane/ethyl acetate 7:3), dichloromethane (DCM), and CHCl3. Then, the sample was applied from the bottom of the gel silica 60 F254 0.25 mm pre-coated TLC plate. Subsequently, the sample fractions were sprayed with Ce(SO4)2.4H2O 1.5% and dissolved in H2SO4 2 N to visualize and obtain characteristics compounds. The collected fraction was also evaluated to be similar in Rf values and color spot by TLC. Finally, the sample was stored in a desiccator for further use as a biological activity assay.
Characterization
UV–Vis spectrophotometry
The sample (1 mg) was dissolved in 5 mL n-hexane, and the spectrum was recorded within the range of 190–380 cm-1 and 0–1.5 absorbance.18-21
Fourier transform infrared (FTIR) spectroscopy
The flour sample was mixed with KBr and made into pellets for analysis preparation. The functional groups were determined according to IR spectrum absorption.18-21
Gas chromatography–mass spectrometry (GC–MS)
The sample extract was analyzed by GC–MS following the described specification on GC–MS/Saturn2200-CP3800 variant, equipped with capillary column DB5-MS. The chromatographic measurement conditions were set at temperature range of 230 to 300°C, with a gradient increase of 4°C min-1, until final temperature was reached.
Phytochemical and Biological Activity of Crude Acetone Extract: About 4 kg of dried flour and approximately 30 g of concentrated extract of stem bark were obtained from 8 kg wet-stem bark of the Datuan plant (FvWM). Table 1 shows the crude acetone which can be extracted from the dried stem bark contains bioactive compounds, such as terpenoids, steroids, and flavonoids on different levels.
Table (1):
Levels of Phytochemical: flavonoids, terpenoids, and steroids in the stem bark of the Datuan plant species (FvWM).
Contents |
Results |
Levels |
|---|---|---|
Flavonoids |
Orange-red colors layer and bit white precipitation |
+ |
Terpenoids/steroids (Lieberman- Burchard) |
The Green color of solutions (anhydrate acetate acid test) and purple-black color of solution (H2SO4 test) |
+++ |
Terpenoids |
brown-red colors |
+++ |
Levels: + low; +++ high
The results showed that an extract of the Datuan plant (FvWM) stem bark has the highest positive levels of terpenoids and steroids, and the lowest levels of flavonoids. The contents of the secondary metabolites are comparable.11 Meanwhile, the color attributes of the sample were expressed according to each content, wherein the orange-red color and white precipitation indicated positive flavonoid. To identify terpenoid and steroid, Liebermann–Burchard reagent was used, while for positive steroid content, a green color was observed using anhydrate acetate acid assay. A purple-black color of solution using H2SO4 assay was an indication of positive steroid, and brown-red color was an indication for positive terpenoid content.
The stock concentration of the crude acetone extract was prepared by dissolving in acetone. The solution was further inoculated with as much as 10 pest samples. The result of the biological activity assay monitoring is presented in Table 2. Furthermore, the percentage of attractive and AI were calculated from nine different treatment times, and the bioactivity of crude acetone extract as an attractant was significantly influenced by the number of warehouse samples.
Table (2):
Biological Activity Assays of the crude acetone extract in the warehouse (S. oryzae L) samples.
Times (Hours) |
n |
A |
B |
Attractive (%) |
AI (Attractive Index) |
|---|---|---|---|---|---|
0 |
10 |
0 |
0 |
0 |
0 |
3 |
10 |
8 |
1 |
80 |
0.75 |
6 |
10 |
6 |
1 |
60 |
0.33 |
9 |
10 |
10 |
0 |
100 |
1.00 |
12 |
10 |
9 |
0 |
86.67 |
0.85 |
15 |
10 |
8 |
2 |
80 |
0.75 |
18 |
10 |
8 |
2 |
80 |
0.75 |
21 |
10 |
10 |
0 |
100 |
1.00 |
24 |
10 |
5 |
5 |
53.30 |
0.13 |
Annotation: ∑(a) is the number of interested insects; ∑(n) is the number of released insects; and ∑(n) is the amount of Blanco insects as a control.
In this study, nine treatments of bioactivity with different times were conducted and the results obtained vary significantly. The percentage of attractive and the AI were calculated, and the behaviors of attractant and pest samples were observed. The bioactivity was increased significantly from 0%; AI = 0 (0 h), 3%; AI = 0.75 (3 h), 60%; AI = 0.33 (6 h), to 100%; AI = 1.00 (9 h) and it was effectively 100%; AI = 1.00 (in 21 h). Also, the behavior of the pests was majorly constant from 86.67%; AI = 0.85 (12 h) to 80%; AI = 0.75 (15 and 18 h), a lower interaction was started 53.3%; AI = 0.13 in 24 h. Overall, the biological activities of the extract as an attractant were effective against the warehouse pests (S. oryzae L.).
Biological Activity of Fractionated Extract Purification
The crude acetone extract was separated using VLC. Fractionation by VLC was selected and appropriate separation solvent systems used were eluents of n-hexane/ethyl acetate 80% and n-hexane/acetone 70%. The selection was performed in accordance with solvent system to identify the chemical compositions which are approximately 17 fractions, as presented in Fig. 1.
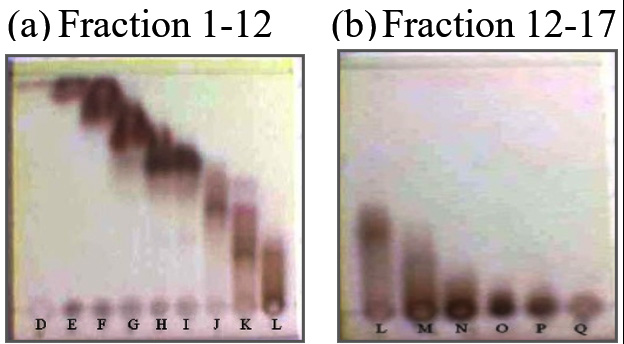
Fig. 1. Profiles of TLC chromatogram of crude aseton extract fractination; (a) Fraction 1-12: eluent n-hexane : ethyl acetate 80%, (b) Fraction 12-17 : eluent n-hexane : acetone 70%.
The developed TLC plates were visualized with 1.5% (CeSO4)2.4H2O dissolved in H2SO4 2 N reagent spray to optimize color development. The chemical composition of 17 fractions of the crude acetone extract of the stem bark was dominated by brown spots which appeared at the bottom, middle, and upper parts of the plates. 17 fractions were evaporated using a vacuum rotary evaporator, dried, and every fraction with a similar track was merged to yield 7 factions, i.e., A (1–3); B (4–6); C(7); D (8–9); E (10); F (11–12); and G (13–17).
Each sample (75 mg) of the merged fraction was dissolved in acetone to assay on the pests (S. oryzae L.). The data presented in the Table 3 shows overall attractive percentage in fractions A, D, and F were 80%, and the AIs obtained were 0.77 (fraction A) and 0.75 (fractions D and F). Surprisingly, at fraction E, negative AI value -1.00 was expressed with an attractive percentage of 33.33% which indicated that the inoculated sample (S. oryzae L.) tends to move towards control material rather than assay substance.
Table (3):
Biological Activity Assays of the fractions (A-G) in the warehouse (S. oryzae L) samples.
Fractions |
N |
A |
B |
Attractive (%) |
AI (Attractive Index) |
|---|---|---|---|---|---|
A |
15 |
12 |
2 |
80 |
0.77 |
B |
15 |
9 |
1 |
60 |
0.57 |
C |
15 |
9 |
3 |
60 |
0.50 |
D |
15 |
12 |
3 |
80 |
0.75 |
E |
15 |
5 |
10 |
33.33 |
-1.00 |
F |
15 |
12 |
3 |
80 |
0.75 |
G |
15 |
5 |
5 |
33.33 |
0 |
Annotation: ∑(a) is the number of interested insects; ∑(n) is the number of released insects; and ∑(n) is the amount of Blanco insects as a control.
Separation of A, F, and D fractions requires several stages via VLC. For A fraction, after several steps of VLC and measurement by gas chromatography (GC), the chromatograms obtained were still complicated and were not resolved. Moreover, the amount of sample was insufficient for further purity and attractant activity assay. The same process was also carried out for F fraction, producing the final result of F4.6 with some impurities. Nevertheless, the amount of sample was less, hence further purity actions were not taken. Therefore, D fraction was chosen for further separation and purification using TLC with an appropriate eluent solvent system (Fig. 2).
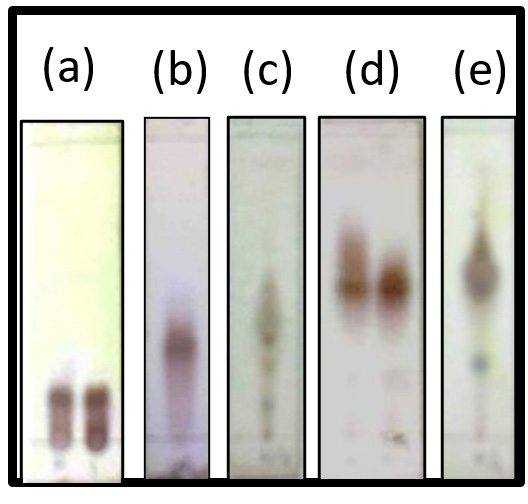
Fig. 2. Profiles of TLC chromatogram of fraction D; (a) Eluent n-hexane : ethyl acetate 90%, (b) Eluent n-hexane ethyl acetate 85%, (c) Eluent n-hexane : ethyl acetate 80%, (d) Eluent n-hexane : ethyl acetate 75%, (e) Eluent n-hexane : ethyl acetate 70%
The result of TLC chromatogram profiles showed D fraction contains some compounds as shown with a track spot on the chromatogram. Therefore, further separation using VLC and saturation with GF254 silica gel 60 as a reserved-phase was done. 15 g sample of the D fraction was separated for re-column with appropriate separation solvent system. The VLC produced 33 fractions, each containing 10 mL. Furthermore, TLC was carried out to represent the whole samples, and the result is shown in Fig. 3a.
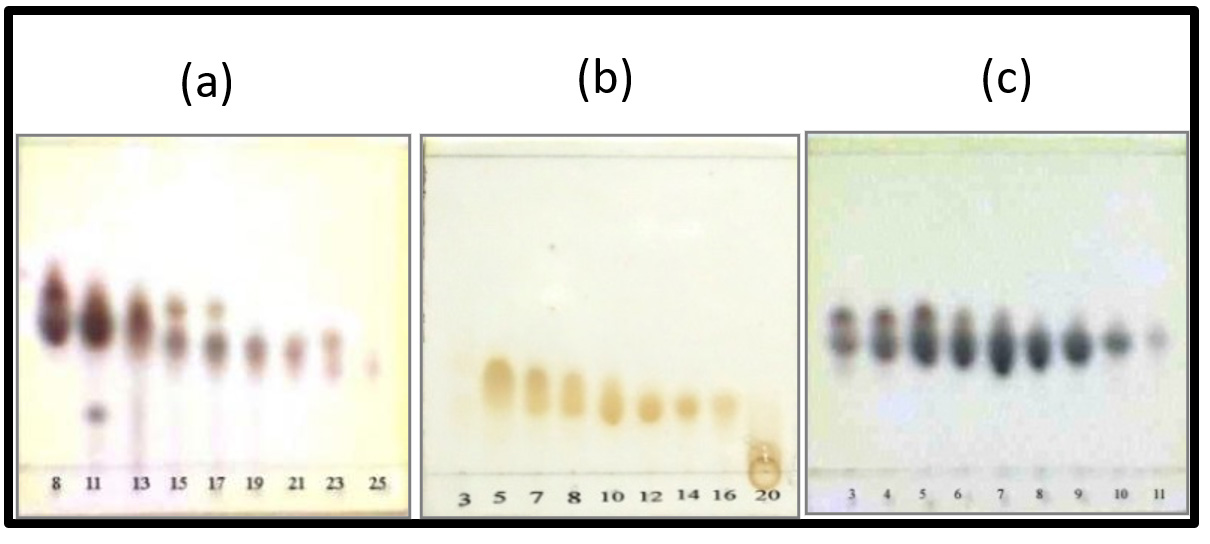
Fig. 3. Profiles of TLC chromatogram of recolumn fractions; (a) Fraction D : eluent n-hexane : ethyl acetate 75%, (b) Fraction D8 : eluent n-hexane : ethyl acetate 87,5%, (c) Fraction D8.3 : eluent n-hexane : ethyl acetate 80%.
The same TLC tracks were merged to produce D1, D2, D3, D4, D5, D6, D7, D8 (8–11), D9 (12–13), D10 (14–18), D11 (19–24),D(25–29), and D13 (30–33) fractions. Among all the fractions, D8 was selected for re-column using eluent variations of n-hexane and ethyl acetate. The result of the re-column of D8 were 20 fractions, then TLC was carried out on these fractions using eluent of n-hexane/ethyl acetate 87.5%, and the result is shown in Fig. 3b. The same tracks of TLC were subsequently combined and 7 fraction combinations were obtained, i.e., D8.1 (1–4); D8.2 (5–6); D8.3 (7–16); D8.4; D8.5; D8.6; and D.7.
D8.3 was selected for re-column, and 16 fractions were obtained. TLC was carried out on the samples of the 6 fractions in order to visualize the TLC profiles of each, and 11 combinations were obtained, namely D8.3.1; D8.3.2; D8.3.3; D8.3.4; D8.3.5 (5–10); D8.3.6; D8.3.7; D8.3.8; D8.3.9; D8.3.10; and D8.3.11. The profiles of the TLC chromatogram of fraction D8.3 are presented in Fig. 3c.
A yellow crystal with some impurities were formed for D8.3.5. Also, the crystal containing D8.3.5 fraction was purified and combined for re-column using eluent variations of n-hexane and ethyl acetate. Furthermore, the re-column results were collected for every 0.5 mL and 36 fractions were obtained. From the 7–24 which were merged as D8.3.5.7 fraction, colorless needle-shaped crystal was formed. The melting points of the crystal are in the range of 136°C–138.7°C. This melting point range implicated that the crystal is not yet pure. Subsequently, the sample containing D8.3.5.7 was further separated with TLC using various eluent system and is presented in Fig. 4 where one final purple spot, and approximately ±50 mg of D8.3.5.7 crystal fraction were obtained. The test carried out with Liebermann–Burchard reagent to identify the phytochemical compound of the crystal showed the sample exhibited purple-black color, meaning the steroid was present in the crystal.
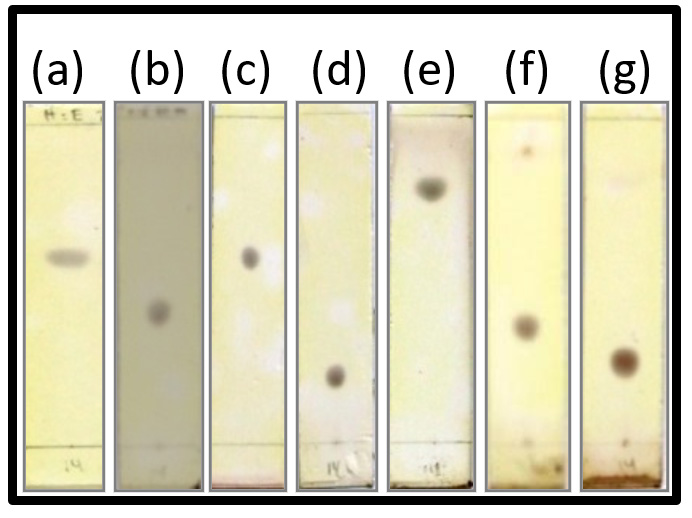
Fig. 4. Profiles of TLC chromatogram of fraction D8.3.5.7; (a) Eluent n-hexane : ethyl acetate 70% (Rf = 0.57), (b) Eluent n-hexane : ethyl acetate 80% (Rf = 0.42), (c) Eluent CCl4 : ethyl acetate 70% (Rf = 0.57), (d) Eluent n-hexane : ethyl acetate 90% (Rf = 0.21), (e) Eluent n-hexane : ethyl acetate 60% (Rf = 0.79), (f) Eluent Dichloromethane (DCM) 100% (Rf = 0.36), (g) Eluent Chloroform (CHCl3) 100% (Rf = 0.24).
To investigate the biological activity of D8.3.5.7 crystal fraction, the sample was tested as an attractant and as much as 15 samples of S. oryzae L. were inoculated. Data in Table 4 shows the pests tend to move towards the material tested as attractant. This activity declined after 21 h, although it was not significant. Based on this investigation, it can be stated that the isolated compound of D8.3.5.7 fraction of the Datuan plant (FvWM) bark is active and effective as an attractant against pests, where the attractive percentage average was 71.67% and AI was 0.63%.
Table (4):
Biological Activity Assays of the fractions D8.3.5.7 in the warehouse (S. oryzae L) samples.
Time (Hour) |
n |
A |
B |
Attractive (%) |
AI (Attractive Index) |
|---|---|---|---|---|---|
0 |
15 |
0 |
0 |
0 |
0 |
3 |
15 |
10 |
4 |
66.67 |
0.55 |
6 |
15 |
12 |
3 |
80 |
0.75 |
9 |
15 |
11 |
3 |
73.33 |
0.67 |
12 |
15 |
11 |
4 |
73.33 |
0.64 |
15 |
15 |
12 |
3 |
80 |
0.75 |
18 |
15 |
12 |
2 |
80 |
0.77 |
21 |
15 |
10 |
5 |
66.67 |
0.50 |
24 |
15 |
8 |
5 |
53.33 |
0.40 |
Annotation: ∑(a) is the number of interested insects; ∑(n) is the number of released insects; and ∑(n) is the amount of blank insects as a control.
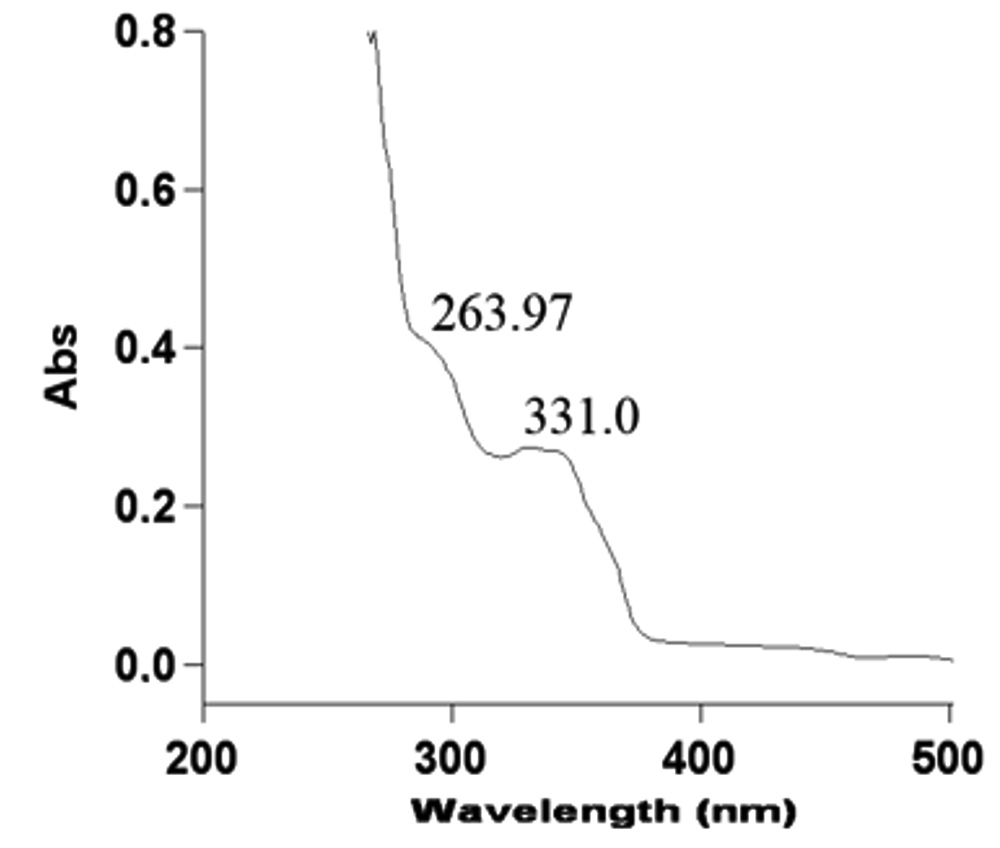
Fig. 5. UV-Vis spectrum of isolated compounds of D8.3.5.7 fraction.
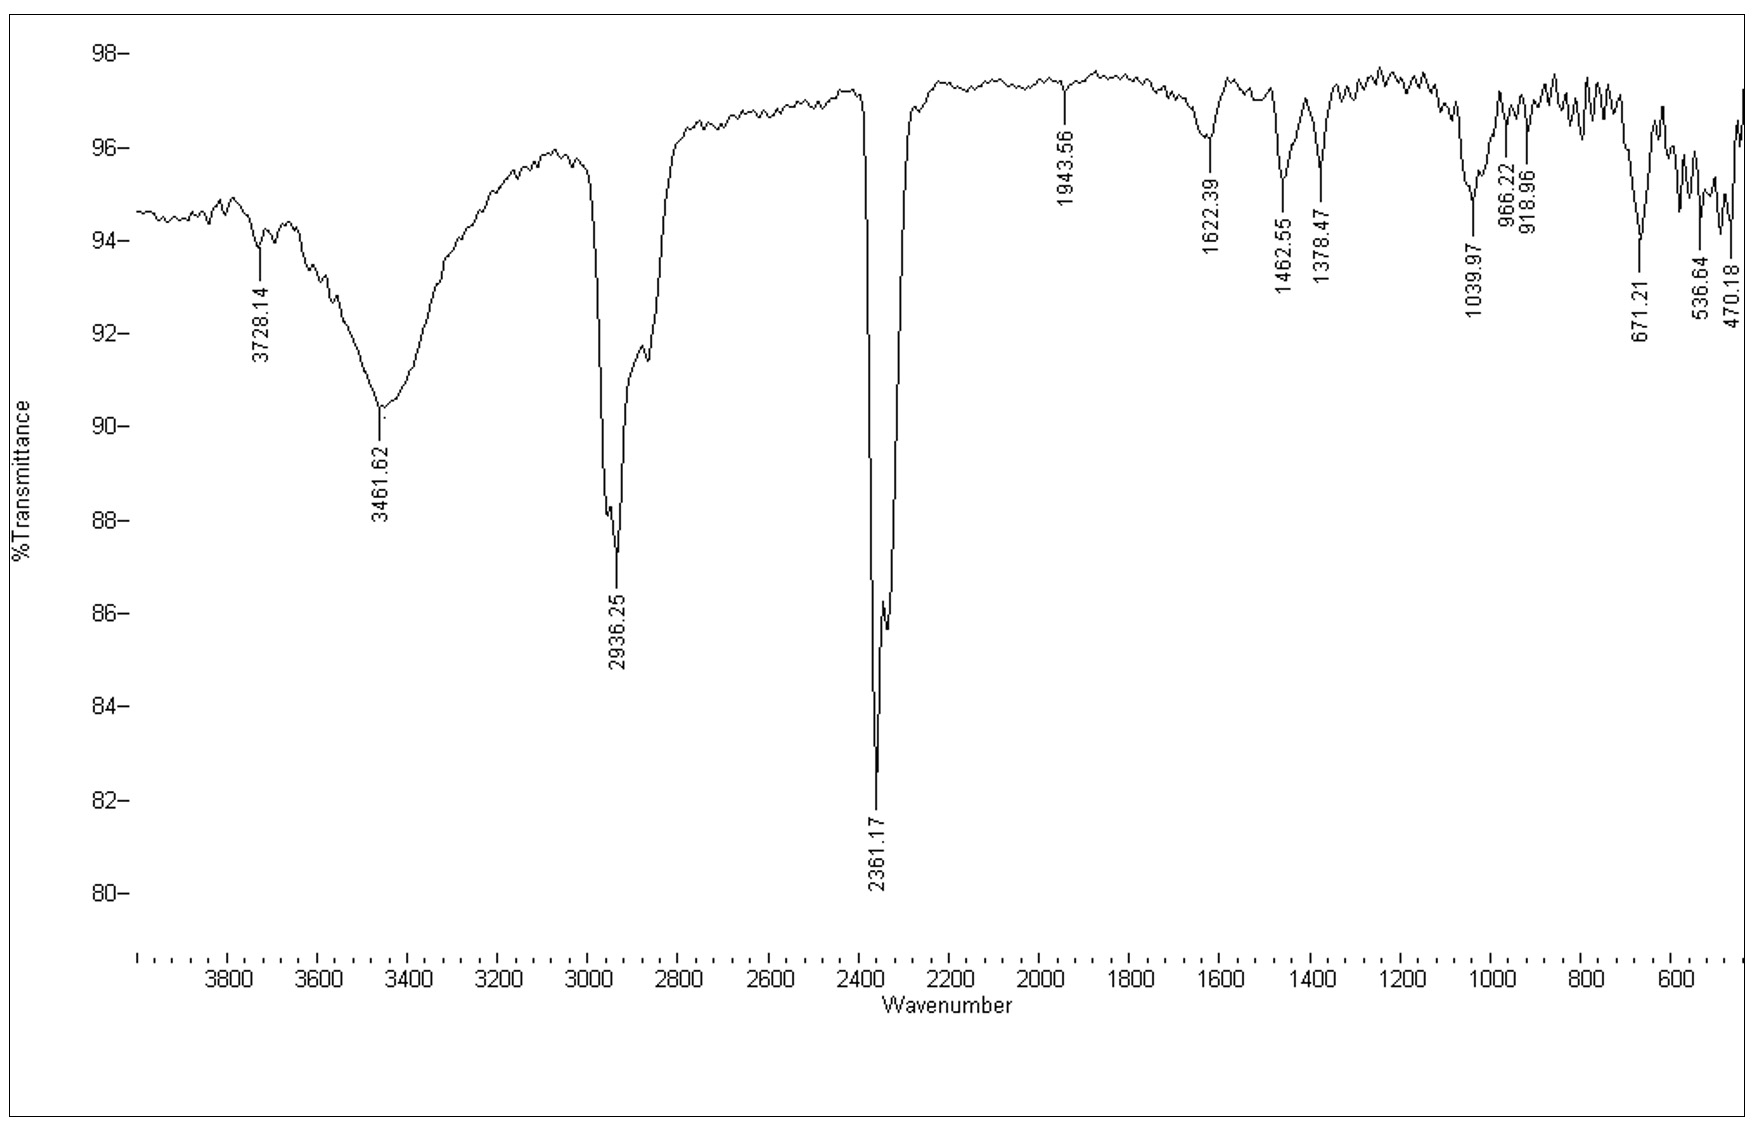
Fig. 6. FTIR spectrum of isolated compounds of D8.3.5.7 fraction.
Some works have reported the biological activity of Ficus sp.22-24 and showed some variations in the results obtained. The volatile compositions of leaf extracts of F. hispida has been investigated on the specificity of fig wasp attractiveness, however the leaf extracts of F. hispida did not show significant activity in the wasp attraction.22 The work on F. ingens has indicated that it attracts its specific wasp pollinator using its odours formed.23 In this work has also been shown that most of the fig species have only one legitimate wasp pollinator species, it is to be expected that different fig species produce different compounds.23 Furthermore, results showed that the chemical analysis of vaporous from F. sycomorus leaves allowed identification the bioactive phytochemicals from F. sycomorus leaves were reported to be more toxic as the fumigant toxicity tests than the contact phase to the tested insects.24 Compared to those reported works, the compound isolated in this work was indicated to show a good attractant activity although the activity test carried out was different.
Structural Properties
UV–Vis spectrophotometry
The UV–Vis spectrum of the isolated compound D8.3.5.7 fraction has maximum absorptions () of 263.97 and 331.0 nm with absorbance values (A) of 0.483 and 0.274, respectively. The λmax 263.97 nm with A = 0.483 was a result of electronic transition π → π* and at λmax 331.0 nm with A = 0.274 was electronic transition due to n → π*. These absorbance values were used to calculate molar absorptivity (ε) with the Beer–Lambert equation using sample with a mass of 0.0014 g, solvent volume 5 mL n-hexane and molecular weight of 414 g/mol (based on the MS result as described in 3.2.3). The data of calculated ε are presented in Table 5.
Table (5):
Molar absorptivity (ɛ) values of the isolated compound of D8.3.5.7 fraction using the Lambert-Beer equation.
Wavelength (nm) |
Absorbance (A) |
Molar absorptivity (ɛ) |
|---|---|---|
263.97 |
0.483 |
714.497 |
331.00 |
0.274 |
405.325 |
Fourier Transform Infrared (FTIR) Spectroscopy
The FTIR spectrum of the isolated compounds D8.3.5.7 fraction is presented in Fig. 7. The sample showed a broadband of 3461.62 cm-1 corresponding to the symmetric and asymmetric stretching of hydrogen-bonded O–H groups. The bands between 1378.47 and 1462.55 cm-1 were indicated by C–H stretching vibration, which were attributed to the CH3 and CH2 groups, respectively. The C–O stretching vibrations were observed at 1039.97 cm-1. Besides, the peak of 1622 cm-1 was ascribed by C=C non-conjugated stretching vibration, which corresponds with absorption of alkene bonded at 918.96 and 966.22 cm-1. This isolated compound of the Datuan plant has no absorption at the aromatic areas at about 3000 cm-1, and also overtone areas at 1604, 1801, 1870, and 1941 cm-1, which showed the isolated compound of D8.3.5.7 fraction has no aromatic chain compounds.18-21 This leads to the absorption spectrum of UV–Vis spectrophotometry measurement which is the absorption under visible light. For details, the bonding properties of FTIR are presented in Table 6.
Table (6):
FTIR absorption areas of the isolated compound of D8.3.5.7 fraction.
Absorption areas (cm-1) |
Vibrations of functional groups |
|---|---|
918.96 |
C-H bending (alkene) |
966.22 |
C-H bending (alkene) |
1039.97 |
C-O stretching (Carbonyl) |
1378.47 |
C-H bending (Methyl) |
1462.55 |
C-H bending (Methylen) |
1622.39 |
C=C stretching (Non-conjugated) |
2936.25 |
C-H stretching (Alkane) |
3461.62 |
O-H strecthing (Alcohol) |
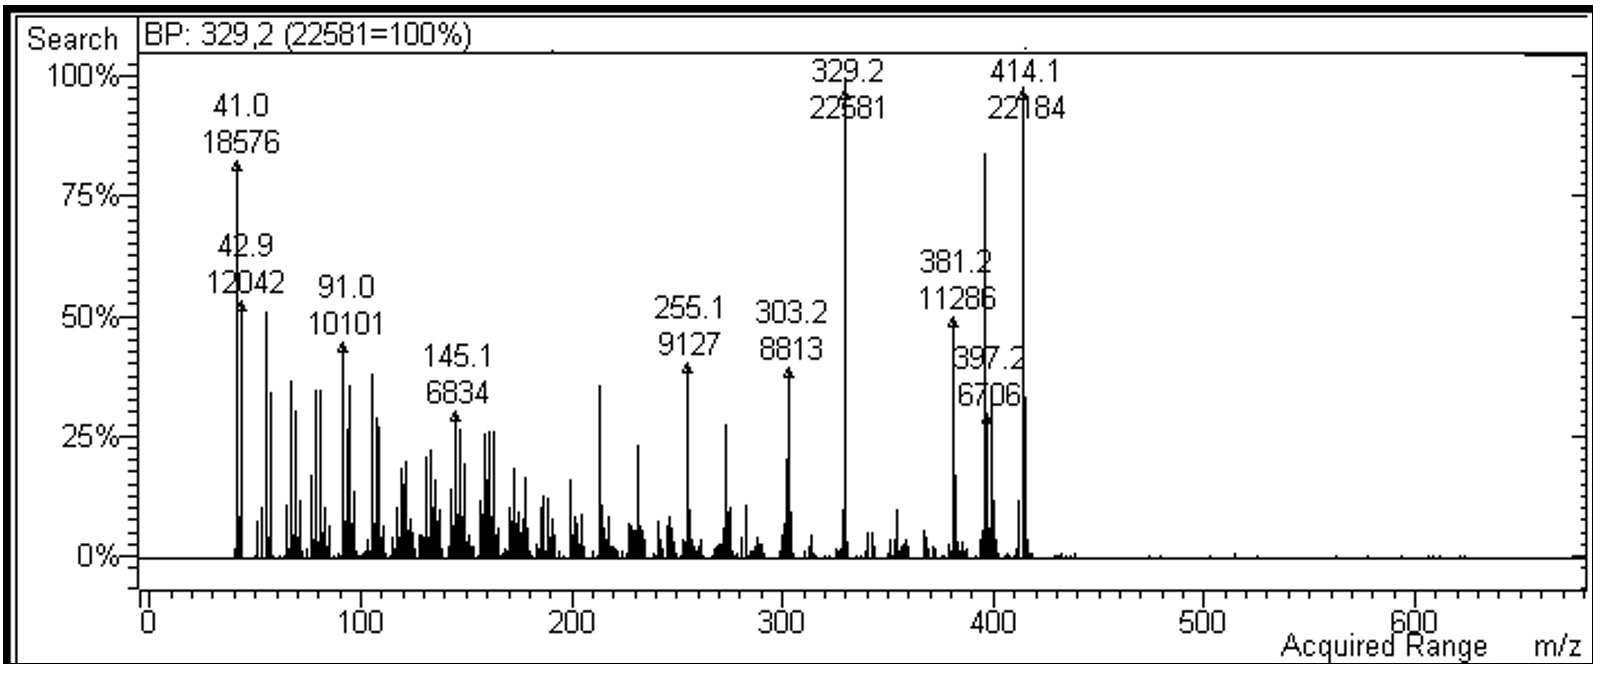
Fig. 7. Mass spectra of isolated compounds of fraction D8.3.5.7.
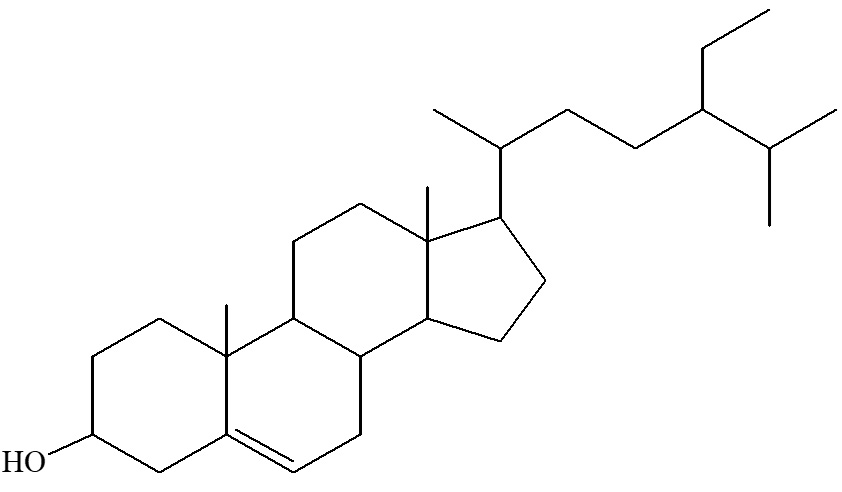
Fig. 8. The proposed structure of (3β, 24S)-stigmast-5-en-3-ol with synonym as β-sitosterol.
Gas chromatography–mass spectrometry (GC–MS)
Fig. 8 presents the typical MS fingerprint of the isolated compound of fraction D8.3.5.7 which was extracted from the stem bark of the Datuan plant (FVWM). The mass spectrum of the sample is mainly characterized by abundant ion peak M+ = 414.1 (100%) and m/e = 392.2 (100%) as the base peak. The ion fragment peaks appeared at m/e = 397.2; m/e = 381.2; m/e = 303.3; m/e = 255.1; m/e = 145; m/e 91.0; m/e = 42.9; and m/e = 41.0. In this case, the retention time (Rt) was obtained as 22.208 min via GC–MS. Based on the FTIR spectra and functional group vibration, absorption of UV–Vis spectrum, and also mass spectra fingerprint of the sample, it was shown that the isolated compound of D8.3.5,7 sample has a chemical formula of C29H50O.
To show the double bond and circumference structure of the compound resulting from the isolation, a double bond equivalent (DBE) calculation was performed as follows:
DBE = Amount of C atoms – (Amount of H atoms)/2 + 1
DBE = 29 − 25 + 1 = 5
Structural Elucidations
The compound from D8.3.5.7 presented in Fig. 9 was isolated from the crude acetone extract of the Datuan plant (FvWM) stem bark. The MS spectrum of this compound showed molecular ion peak at M+ = 414.1 (100%). According to nitrogen rule, a compound having an even molecular weight contains C, H and O atoms or when the compound contains nitrogen atoms, then the number of nitrogen atoms needs to be even.25 Therefore, it is assumed that this compound does not contain nitrogen because based on the infrared spectrum, there is no N-H stretching vibration absorption in the 3300-3400 cm-1 region or C-N stretching in the 1020-1250 cm-1 region. Based on this analyses and the molecular weight of the compound with formula of C29H50O, it was suggested that the compound is a steroid. Therefore, the proposed structure of isolate from D8.3.5.7 fraction is (3β, 24S)-stigmast-5-en-3-ol and it is also known as β-sitosterol.12
The isolated compound from D8.3.5.7 fraction was obtained in the form of a colorless needle-shaped crystal with a melting point of 136°C–138.7°C, and mass of approximately ± 50 mg. Also, UV–Vis spectrophotometry, FTIR, and GC–MS showed the isolated compound is (3β, 24S)-stigmast-5-en-3-ol which is synonymous with β-sitosterol, and its molecular formula is C29H50O, while its molecular weight is M+ = 141.1 g/mol. Moreover, it is considered as a steroid compound. The bioactivity assay result of the samples showed the Datuan plant is effective as an attractant against pests (S. oryzae L.), with attractive percentage average and AI were 71.67% and 0.63, respectively.
ACKNOWLEDGMENTS
Our gratitude to Research and Community Services, Universitas Lampung that have provided funding for Basic Research Grants (Penelitian Dasar). We also thank Enago (www.enago.com) for English review and proofreading of this paper.
CONFLICT OF INTEREST
The authors declare that there is no conflict of interest.
AUTHORS’ CONTRIBUTION
All authors have made substantial, direct and intellectual contribution to the work and approved it for publication.
FUNDING
This study was funded by Universitas Lampung, Basic Research Grants (Penelitian Dasar) 2020.
ETHICS STATEMENT
This article does not contain any studies with human participants or animals performed by any of the authors.
AVAILABILITY OF DATA
All datasets generated or analyzed during this study are included in the manuscript.
- Berg CC, Classification and distribution of Ficus. Experientia. 1989;45:605-611.
Crossref - Van Noort S, Gardiner AJ, Tolley KA. New records of Ficus (Moraceae) species emphasize the conservation significance of inselbergs in Mozambique. South Afr J Bot. 2007;73(4):642-649.
Crossref - Yusuf R. Ecological and Diversity distribution of Ficus spp.. Berkala Penel Hayati, Special Ed. 2011;5(A):83-91. (in Indonesian)
- Shi Y-X, Xu Y-K, Hu H-B, Na Z, Wang W-H. Preliminary assessment of antioxidant activity of young edible leaves of seven Ficus species in the ethnic diet in Xishuangbanna, Southwest China. Food Chem. 2011;128(4):889-894.
Crossref - Li JJ, Mo L, Song JL. Improvement effect of Ficus vasculosa ethanol extract on D-galactose-Induced mice aging. SAGE Nat Prod Comm. 2019;14(12):1-7.
Crossref - Hendrayana Y, Widodo P, Kusmana C, Widhiono I. Diversity and distribution of figs (Ficus spp.) across altitudes in Gunung Tilu, Kuningan, West Java, Indonesia. Biodiversitas. 2019;20(6):1568-1574.
Crossref - Slatnar A, Klancar U, Stampar F, Veberic R. Effect of drying of Figs (Ficus carica L.) on the contents of sugars, organic acids, and phenolic compounds. J Agri Food Chem. 2011;59(21):11696-11702.
Crossref - Chawla A, Kaur R, Sharma AK. Ficus carica Linn.: A review on its pharmacognostic, phytochemical and pharmacological aspects. Int J Pharm Phytopharm Res. 2012;1(4):215-232.
- Sandabe UK, Onyeyili PA, Chibuzo GA. Phytochemical screening and effect of aqueous extract of Ficus sycomorus L. (Moraceae) stembark on muscular activity in laboratory animals. J Ethnopharm. 2006;103(3):481-483.
Crossref - Mawa S, Husain K, Jantan I. Ficus carica L. (Moraceae): phytochemistry, traditional uses and biological activities. Ev Based Complement Alternat Med. 2013;2013:974256.
Crossref - Chen L-W, Cheng M-J, Peng C-F, Chen I-S. Secondary metabolites and antimycobacterial activities from the roots of Ficus nervosa. Chem Biodivers. 2010;7(7):1814-1821.
Crossref - Kuete V, Kamga J, Sandjo LP, et al. Antimicrobial activities of the methanol extract, fractions and compounds from Ficus polita Vahl. (Moraceae). BMC Complement Alterna Med. 2011;11:6.
Crossref - Wu PL, Rao KV, Su CH, Kuoh CS, Wu TS. Phenanthroindolizidine alkaloids and their cytotoxicity from the leaves of Ficus septica. Heterocycles. 2002;57(12):2401-2408.
Crossref - Chiang YM, Chang JY, Kuo CC, Chang CY, Kuo YH. Cytotoxic triterpenes from the aerial roots of Ficus microcarpa. Phytochemistry. 2005;66(4):495-501.
Crossref - Lansky EP, Paavilainen HM, Pawlus AD, Newman RB. Ficus spp. (fig): Ethnobotany and potential as anticancer and anti-inflammatory agents. J Ethnopharm. 2008;119(2):195-213.
Crossref - Channabasavaraj KP, Badami S, Bhojraj S. Hepatoprotective and antioxidant activity of methanol extract of Ficus glomerate. J Nat Med. 2008;62(3):379-383.
Crossref - Alonso-Amelot ME, Avila-Núñez JE. Comparison of seven methods for stored cereal losses to insects for their application in rural conditions. J Stored Prod Res. 2011;47(2):82-87.
Crossref - Hadi S, Noviany. The Isolation of Hopeaphenol, a Tetramer Stilbene, from Shorea ovalis Blume. Adv Nat Appl Sci. 2009;3(1):107-112.
- Suhartati T, Yandri, Suwandi JF, Hadi S. In vitro and in vivo antiplasmodial activity of oxyresveratrol and artonine isolated from two Artocarpus plants in Indonesia. Orient J Chem. 2010;26(3):825-830.
- Noviany N, Nurhidayat A, Hadi S, et al. Sesbagrandiflorain A and B: isolation of two new 2-arylbenzofurans from the stem bark of Sesbania grandiflora. Nat Prod Res. 2018;32:2558-2564.
Crossref - Noviany N, Sialdian D, Setiawan A, Irawan B, Azmi MN, Hadi S. Bioassay-Guided Separation Approach for Characterization of New Antibacterial Fractions from the Stem Roots Extracts of Archidendron jiringa. J Turk Chem Sect A. 2021;8(2):393-404.
Crossref - Song Q, Yang D, Zhang G, Yang C. Volatiles from Ficus hispida and Their Attractiveness to Fig Wasps. J Chem Eco. 2001;27(10):1929-1942.
Crossref - Barker NP. Evidence of a volatile attractant in Ficus ingens (Moraceae). Bothalia. 1984;15(3/4):a1854.
Crossref - Romeh AA. Phytochemicals from Ficus sycomorus L. leaves act as insecticides and acaricide. Afr J Agri Res. 2013;8(27):3571-3579.
Crossref - Pellegrin V. Molecular formulas of organic compounds: the nitrogen rule and degree of unsaturation. J Chem Edu. 1983;60(8):626.
Crossref
© The Author(s) 2021. Open Access. This article is distributed under the terms of the Creative Commons Attribution 4.0 International License which permits unrestricted use, sharing, distribution, and reproduction in any medium, provided you give appropriate credit to the original author(s) and the source, provide a link to the Creative Commons license, and indicate if changes were made.